Globalisation is simply the
expression of the increasing division of labour
It may also now be seen clearly what
globalisation is. Globalisation is not some special process and it is not
fundamentally about national boundaries. It is simply the extension of the
division of labour under circumstances in which the world economy has become so
large and so interconnected that an efficient division of labour can no longer
be carried on simply within national boundaries.
The development of continental
scale integrated economies
If I may present another aside, this
process also gives a clear indication of what is the present stage of the
development of division of labour. The era where West European sized national
economies were capable of creating the most efficient
division of labour and economies of scale has been left behind. The strength of
the United States is that the US was the first modern continental-sized
economy. The Soviet Union was in a sense the second continental scale economy –
but this one collapsed and was balkanised. The third continental-scale economy
is China. The fourth continental scale economy is India. And at the present
time Western Europe is rather failing to create the fifth continental-scale
economy – but the future will see what happens.
Historical development of a
rising level of investment
Having spent a long time examining the
most powerful productive force, the social division of labour, I now want to
analyse in more detail the second most powerful force in economic growth –
investment.
Slide 30 shows the historical tendency of
the proportion of the economy devoted to investment to rise. This was a process
identified by Adam Smith, was analysed at great length by Karl Marx, and was
one of the foundations of the economic theories of John Maynard Keynes. As can
be seen this process has been operating over the entire period for which it is
possible to get serious statistical economic data and it may therefore be taken
as one of the most well established of economic trends.
Slide
30

To summarise briefly the chief features,
and periods, shown in Slide 30, the first economy for which it is possible to
calculate relatively meaningful statistics for the proportion of the economy
devoted to investment was England in 1688. The reason for this is because
England was about to become the world’s first industrial state, it was the most
developed economy in the world, and so it had the best statistics. There is a
discussion among economic historians whether at that time England invested 5%
of GDP or 7% of GDP but this does not matter for present purposes because it is
so low compared to the levels of investment in a modern economy. This 5-7% of
GDP devoted to investment, however, allowed England to create the first
industrialised economy in the world.
Slide 30 makes clear what happened in the
next 300 years – a constantly rising proportion of the economy devoted to fixed
investment which has had more and more rapid rates of economic growth
associated with it.
Here we may also note that China
underlines and characterises its system as having ‘Chinese characteristics’ –
therefore ‘socialism with Chinese characteristics’, a legal system ‘with
Chinese characteristics’ etc. I would also insist as a fundamental
methodological principle that every country, indeed every entity, is unique -
so each respective country will have ‘US characteristics’, ‘British
characteristics’, ‘Russian characteristics’, ‘South African characteristics’
etc. But, as already discussed, these are unique combinations of universal
processes.
China’s current level of investment, of
more than 40% of GDP, therefore indeed has very specific ‘Chinese
characteristics’. But it is also the continuation of a trend of 300 years of
history of rising proportion of the economy devoted to investment.
To take some of the key stages of
development in this historic process
England
achieved from around 1688 a level of 5-7% of GDP devoted to fixed investment
generating an rate of economic growth of around 2%.
The
US, from the aftermath of the Civil War onwards, devoted about 18% of GDP to
investment, enabling it to grow at about 3.5% a year as opposed to England’s
2%. Consequently, during the 1870s, the US overtook Britain to become the
world’s largest economy.
After
World War II Germany invested about 25% of GDP, generating 5% annual economic
growth and creating the post post-war German ‘economic miracle’.
In
the 1960s and early 1970s Japan invested about 30% of GDP and its economy grew
at 7- 8% a year.
China
now invests over 40% of GDP and its annual average growth rate is 10%.
This historical trend is so clear
doubtless in the future some economy will invest 50% of GDP and grow
sustainably at 12% a year. But that’s for the future. Presently China has the
world’s highest investment rate and the world’s fastest growth rate.
China
and India’s efficiency in the use of investment for growth
As we have already seen that, after the
division of labour, investment is the most powerful contributor to economic
growth it is, of course, evident why a rising level of investment is associated
with rising economic growth rates. However to use investment efficiently the
economy has to be orientated towards international market.
This was a mistake of the Soviet economy.
The Soviet economy was orientated towards its own internal domestic market and
therefore could not use investment efficiently. However provided that the
orientation to the (in the modern world necessarily international) division of
labour is maintained, and to the efficient use of investment, it is the
quantitative amount invested that determines how rapidly an economy grows. And
considering the intermediate/long term trend, after participation in the
international division of labour, it is the proportion of the economy as that
is devoted to investment which is decisive. This is what studying economic
history shows as well as modern econometrics.
In order to illustrate this in more
detail consider the two most rapidly growing modern economies – China and India.
Both have achieved highly efficient use of investment from the point of view of
generating economic growth. What is technically known as the Incremental
Capital Output Ratio (ICOR) for both countries is 3.7 – this is the percentage
of GDP that has to be invested for the economy to grow by 1% is 3.7% (i.e.
China and India both have a ratio of investment to growth of 3.7:1 - the lower
the number the more efficient the investment).
China and India’s levels of efficiency of
investment, from the point of view of economic growth, are among the best ever
achieved for a sustained period – in the case of China it has been sustained
for over two decades and in India for a decade and a half. The reason that the
Chinese and Indian economies grow so fast is therefore simple: they both have a
high efficiency of use of investment and a very high proportion of GDP devoted
to investment.
To show this Slide 31 simplifies the
previous graph to show just the post-World War II rates of investment of China,
India and the US. As may be seen China invests more than 40% of GDP, India
invests around 35% of GDP, and the US invested around 18% of GDP prior to the
international financial crisis – following which its rate of investment fell
further. On the basis that the rate of investment in the
United States is only half that of China and India the US cannot possibly match
their growth rates or increasing competitive power.
It is the consequence of this new
situation in the world economy that led directly to the international financial
crisis.
Slide
31

The declining competivity
of the US economy
A historical feature of the US was its
extremely stable rate of growth - linked to a stable rate of investment. The US economy, with significant fluctuations
only in 1929 and during the two World Wars, has been growing at close to 3.5% a
year for the last 150 years. It was the most predictable growth rate actor in
the world economy for the simple reason that the US was the most powerful
country in the world. The US was therefore normally able to retain stability
even if problems were pushed onto other economies. This latter possibility will
be looked at in detail later in analysing the situation in regard to Japan. But
to summarise what will be demonstrated at length later, the economic policies
pursued by both Nixon and Reagan, for example, had deeply damaging consequences
for Japan – Nixon via the oil price increase of 1973, which the US in fact
supported, and a forced increase in the exchange rate of the yen in 1971, and
Regan in forcing Japan to adopt very low interest rates, to aid the US economy
after the 1987 stock market crash, which culminated in Japan’s ‘bubble economy’
and post-1990 economic crisis. Historically, with the exception of 1929, the
peacetime US economy was able to maintain its own stability even when other
economies suffered problems. But now the US has been radically overtaken in its
level of investment by a whole series of countries, and its competivity
has declined – the consequences of this led directly to the financial crisis.
Why is it possible to know that the US
economy is increasingly uncompetitive and what happens under such
circumstances? Surveys of business people saying that the US economy is the
most competitive in the world, or citing the evident fact that in certain spheres
of high technology industry, or in the military sphere, the US is the most
advanced in the world are not relevant and frequently used to divert attention
from the real process of the decline of US competivity.
Economic and business competition does not take place via opinion surveys or
newspaper articles, or individual sectors of production. It takes place in
overall competitive markets and is reflected in the monetary flows that result
from these.
The way to know whether
the US economy can compete or not is to examine its balance of trade – which in
turn dominates the US balance of payment.
The situation of this is shown clearly in Slide 32, which charts the US balance
of trade as a percentage of GDP.
As may be seen until the 1970s the US
economy was relatively competitive – that is its balance of trade balanced.
From the beginning of the 1980s onwards, however, the US economy became
progressively less competitive – the US balance of trade moved into
progressively wider deficit. The final upward movement at the end of the graph,
the narrowing of the balance of trade deficit, was the effect of the financial
crisis and will be analysed later.
Slide
32

Financial inflows into the US
The US trade deficit raises the question
of how this was financed, and this in turn leads directly to the financial
crisis and to issues already analysed concerning China and the US.
To show the link between the trade and
financial flows processes Slide 33 charts the long term change in the exchange
rate of the dollar against the yen and against the Deutsche Mark and its
successor the euro.
As can be seen from Slide 33 there are
three post-World War II periods in the development of the dollar’s exchange
rate.
The first is from immediately after the
Second World War to the early 1970s. This is the period of fixed exchange rates
under the Bretton Woods agreement. Of course in that
period the exchange rate of the dollar is stable.
The second period is that of the
relatively rapid devaluation of the dollar from the early 1970s until 1980.
The third period is that from 1980 until
the early 2000s - in which there is again a stable exchange rate of the dollar.
This third phase is sometimes referred to as ‘Bretton
Woods 2’. It differs from the original Bretton Woods
period in that there is no formal agreement to have fixed exchange rates but
the actual reality is that the dollar’s exchange rate has not moved greatly –
there are short term fluctuations but no major overall movement.
Slide
33

How, therefore, was the dollar’s exchange
rate stabilised under the conditions shown in Slide 32 of a sharply
deteriorating US balance of trade, and also a US balance of payments deficit?
If trade had been the sole determinant then the outflow of dollars, due to the
balance of payments deficit, would have led to a decline in the exchange rate
of the dollar. For the dollar’s exchange rate to remain stable there had to be
an equal inflow of finance into the US to match the outflow due to the balance
of payments deficit. This, of course, is what occurred - as shown in Slide 34
which charts the
inflow of portfolio investment into the US.
The danger is evidently that the graph in
Slide 34 might be interpreted as that of ‘a financial addict’. That is the
inflow of finance into the US rose constantly as a percentage of GDP. This was
bound to break down at some point – and it did so in the financial crisis as
will be seen below.
Slide
34

Why was the dollar not devalued?
From the data above the interrelation of
the financial and competivity aspects of the US
balance of payments is clear. But a question is posed. Why from the 1980s
onwards did the US break with the policy of devaluing the dollar that it has
had used in the 1970s to maintain equilibrium in its balance of payments?
While the US, due to its too low rate of
investment, was gradually loosing competivity it
could theoretically have compensated for that, in terms of maintaining a balance of payments equilibrium, by dollar devaluations.
If the US lost 1-2% competivity each year due to its
lower investment rate, it could have devalued the dollar by 1-2% a year and its
balance of payments would have remained in equilibrium. There would therefore
have been no need for a very large huge inflow of finance from abroad. This is
what happened during the 1970s – the second period of exchange rate movements
analysed above. During the 1970s the US devalued the dollar and its balance of
payments remained in balance despite the fact that its economy’s underlying competivity was declining.
Why, therefore, did the US not continue
this course pursued during the 1970s? Why did it turn from the 1980s onwards to
ending the dollar devaluation and instead maintained a relatively stable
exchange rate?
The answer lies in politics. It’s very
easy to propose theoretically that the dollar should devalue. But it is
drastically politically unpopular in the United States. To see this simply note
who were the two US presidents who presided over the decline in the exchange
rate of the dollar? First Nixon - who was driven from office in disgrace, and
then Carter who was considered as the worst and most ineffectual post-World War
II US president (perhaps prior to George W. Bush).
It might appear that the reasons for
Nixon and Carter’s unpopularity were due to contingent factors – Nixon because
of the Watergate break in and Carter due to the Iran hostage crisis and other
factors. But when the ‘accidents’ happen against the same background there is a
pattern to them – someone said that ‘history is the natural selection of
accidents’. The economic basis of the unpopularity of Nixon and Carter is
clear. Devaluing the dollar puts up the prices of imports into the United
States, increases inflation, and cuts the living standards of the population.
US competivity was maintained by a declining exchange
rate of the dollar under Nixon and Carter but at the expense of massive
political unpopularity.
Reagan and Clinton reversed this policy,
stabilised the dollar, and were both re-elected. Under both presidents the competivity of the United States went down, the US balance
of payments moved into drastic deficit - and both were re-elected. Both in
essence were popular because they borrowed huge sums of money abroad – because
this was this which, as shown in Slide 34, stabilised the dollar.
As long as loans flowed in popularity continued.
It is an analogy to an international
credit card financing US consumption on a huge scale. Provided you never think
about repayment you feel good on a credit card as you spend above your income.
The problem comes when, worst case, you have to repay debt or, slightly less
serious but still very uncomfortable, when the credit card company will no
longer lend you money. In that case you have to drastically reduce expenditure.
This is what happened in the financial crisis.
To show this process Slide 35 shows what
happened to the US monthly balance of trade deficit in dollar terms. As can be
seen it widened progressively until 2005 when it reached almost $70 billion a
month (equivalent to over $800 billion a year), began to reduce slightly after
this, and then from mid-2008 violently contracted under the impact of the
international financial crisis to around $30 billion a month – it has since
widened again slightly.
Recall that to prevent the dollar
devaluing, under conditions where there is an outflow of dollars, from the
balance of trade and balance of payments deficits there must be an equal inflow
of finance in the US. But the contraction of the trade deficit, which dominates
the US balance of payments, meant that the inflow to stabilise the dollar was
reduced by several hundred billion dollars a year – or to put it another way
the inflow of goods and services that were not being paid for, except by
borrowing, shrank drastically. Borrowing on the ‘international credit card’ was
cut abruptly. Consequently expenditure by the US economy had to be reduced.
Slide
35

The reduction of expenditure in
the US
Confronted with situation of a forced
reduction in expenditure the US economy could have responded in one of two ways
– or by a combination of the two. First the US could have reduced consumption expenditure. This would
have meant a reduction in personal consumption or reduction in government
expenditure – including military expenditure which, from an economic point of
view, is government consumption. Or alternatively the US could have drastically
reduced expenditure on investment.
Which actually occurred was examined
earlier and I reproduce Slide 9 above as Slide 36 to recall the outcome. As
already analysed the overwhelming bulk of the reduction in US expenditure took
place in investment. The fact that in Slide 36 the positive movement in net
exports, i.e. the reduction in the trade deficit, and the fall in fixed
investment are almost the same in their scale but with reversed signs shows the
essence of the reaction of the US economy to the financial crisis. The US
redirected resources from investment into net exports while leaving consumption
relatively little changed. US personal consumption fell by a relatively small amount,
US military expenditure actually increased, but investment was allowed to
decline severely.
Slide 36

The medium and long term result of this
outcome is evident from data give earlier. As has seen the underlying cause of
the decline in competivity of the US is its too low
rate of investment compared to its competitors – above all compared to China.
The effect of the financial crisis, by leading to an even further fall in US
investment, has therefore made the structure of the US economy worse.
US competitive policy to attempt
to slow down China’s economy
As the level of investment in the US
economy has actually fallen it is evidently unable to accelerate its own
economic growth to compete with China. However it is evident
that that the US will not give up without a competitive struggle its position
as the world’s largest economy. Another way the position of the US can be
maintained is therefore to attempt to slow down China’s economy.
There are three major means to attempt to do this at present, complimented by
several minor ones.
The major means to attempt to slow down
China’s GDP growth rate are:
To
attempt to force the exchange rate of China’s currency, the RMB, to go up too
fast and too rapidly.
To
attempt to force China to cut its investment rate.
To
attempt to discourage foreign investment from entering China.
The more minor, but significant, ones
are:
To
prevent China having access to foreign technology.
To
prevent China buying assets abroad.
Each of these instruments has been used
by the US as a competitive policy previously in regard to other countries and
each will be analysed in turn.
The Asian dimension of the
financial crisis
The competitive means used by the US to
attempt to slow down China’s economy can best be understood if it is realised
that there is a specific Asian dimension to the present financial crisis. From
within Asia this could indeed be described as the ‘third great Asian financial
crisis’ – the previous two being the situation in Japan after 1973 and the debt
crisis in South-East Asia in 1997, which of course rolled into Russia in 1998
(I was here at the time of the rouble devaluation and remember it vividly). We
will therefore move from looking at the world dimensions of the financial
crisis to looking at its specifically Asian aspect.
I have set out schematically these three
major Asian economic/financial crises:
The
first Asia financial crisis 1973-1990 in Japan.
The
second in 1997 in South East Asia.
The
third one is the current (international, since 2008) crisis.
To summarising the entire period of the
last four decades, Slide 37 shows the cumulative effect of the last forty
years, including these three Asian financial crises, on the changes in growth
rates of the four largest Asian economies – Japan, China, India and South
Korea.
What this chart graphs is not the absolute
rate of growth of GDP but the change in the rate of GDP growth for each
country compared to the beginning of the 1970s. The 0% line on the graph
therefore does not mean 0% absolute growth. It means that the growth rate was
the same as 1970s. If the curve is
moving upwards the economy has accelerated, if the curves are going down an
economy is growing more slowly.
As can be seen the big losers of the
successive economic developments and financial crises in the last forty years
in Asia were South Korea, the growth rate of which slowed down by 4-5% a year,
and above all Japan, the growth rate of which slowed down by 8-9%. Indeed
finally Japan’s economy is today essentially static. The big gainers,
that is the countries which went through the Asian crises successfully,
were China and India – the economies of both of which accelerated
significantly.
The three Asian financial crises will be
considered in chronological order.
Slide 37

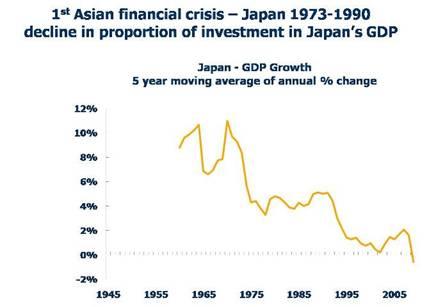
1973-1990 Japan’s economic and
financial crisis
During the period 1973-1990 Japan
accumulated the preconditions of a financial crisis which has become among the
most devastating for a major economy in modern economic history. The dimensions
of this crisis, in terms of slowdown in rate of growth of GDP may be seen in
Slide 38. This shows the deceleration of Japan’s economic growth - from an
average 8-9% a year in the early 1970s, first to around 4% a year in the 1970s
and 1980s, and then to essentially zero in the 1990s and beginning of the 21st century. The annual GDP growth in the graph
is expressed as a five yearly moving average to remove the effect of purely
short term fluctuations.
Slide 38
What international conditions caused this
drastic slowdown? And how did each strengthen the competitive position of the
US economy compared to Japan’s?
The first development, which, it should
be said immediately, would not have the same effect on the
relative competitive positions of Japan and the US today, was the drastic
increases in the price of oil in 1973 and 1979. At that time this benefited the
US economy, compared to its competitors, as the US was far less reliant on oil
imports than either Japan or its own situation today. The drastic oil price
rise therefore aided the US vis-a-vis
Japan. Today, however, the US has become far more dependent on oil imports and
an equivalent oil price increase would not aid it vis-a-vis
its competitors in the same way.
The second issue was the shift in the
exchange rates between the Japanese yen and the US dollar which started in the
period after 1971 and which is shown in Slide 39.
In Slide 39, in order to make a
comparison with China, the horizontal axis shows the number of months since a
rise in the exchange rate began. As can
be seen the exchange rate of the yen against the dollar has increased in the
period between 1971 and today by 300%.
To give more precise chronology, the
yen’s exchange rate went up in two periods. The first, between 1971 and 1985,
saw an increase in the yen’s exchange rate of around 50% compared to its
pre-1971 rate. This was associated with the deceleration of Japan’s rate of
growth of GDP from 8-9% a year to 4% a year - as shown in Slide 38. After 1985
came a second, much greater, increase in the exchange rate of the yen to around
300% of its pre-1971 level. This was associated, as shown in Slide 38, with a
slowdown in the rate of growth of Japan’s economy eventually to essentially
zero. This huge increase in the exchange rate of the yen evidently helped
drastically slow the Japanese economy.
Slide 39

To make an international comparison,
Slide 40 shows the increase in both the exchange rate of the yen and the D-Mark/euro
against the dollar – the middle line, rising about 150%, is the German (and
then European) currency. The increase in the exchange rate of the German
currency against the dollar was about half that of the yen. The European
economies slowed, but not as drastically as Japan.
The US was well aware that an increase in
the exchange rate of a currency is a powerful instrument for slowing down an
economy – in 1961 the US had ensured a German currency revaluation, putting an
end to the extremely rapid growth rate of the post-war ‘German economic
miracle’.
The extremely sharp increase in the
exchange rate of the yen after 1971 did almost nothing to eliminate Japan’s
trade surplus – as a percentage of Japan’s GDP it is almost exactly the same
nearly forty years later as it was in 1971. But the increase in the exchange
rate of the yen broke the rapid rise of Japanese exports, which incidentally
had been matched by an almost as rapid a rise of its imports, thereby slowing
Japan’s entire economy. Forcing an increase in the exchange rate of the yen
therefore was of no use in decreasing Japan’s trade surplus but it was
extremely effective in slowing Japan’s economy – just as the enforced
revaluation of Germany’s currency had been in 1961.
To turn to a current issue the US
administration may, or may not, be genuinely deluding itself into believing
that an increase in the RMB’s exchange rate would decrease China’s trade
surplus – this is something we will look at later. But the US administration
must be aware, as it has had much previous experience of similar issues, that
an increase in the RMBs exchange rate might be very effective in slowing
China’s economy. We will look at that issue in detail later.
Slide
40

Finally, regarding the first great Asian
financial crisis, consider the internal development of Japan’s economy after
1973.
It was analysed earlier that the primary
source of GDP growth, after increasing participation in division of labour, is
increase in fixed investment. Slide 41 therefore graphs the percentage of
Japan’s GDP devoted to fixed investment. As may be seen pattern is clear and in
line with econometric
studies on the sources of growth shown earlier. The extremely rapid growth of
Japan’s economy in the period from the 1950s up to 1973 was associated, as
would be expected from the econometric data, with a very high, and until 1973
rising, proportion of its economy devoted to investment – reaching a peak of
35% of GDP. After 1973 the share of Japan’s economy devoted to investment fell
almost continuously until now it has reached a level of only around 20% of GDP
– indeed in the 4th quarter of 2009 it actually fell below 19%.
With this drastic decline in the share of
investment in the economy Japan was, of course, incapable of achieving the
rapid economic growth rates it had achieved prior to 1973.
The achievement of US competitive
advantage was therefore clear. By forcing up the exchange rate of the yen,
initially through the threat of tariffs used by Nixon and later by other means,
Japan’s economy was slowed. By the reduction in the rate of investment Japan
became incapable of the very rapid economic growth which had allowed it to
narrow the gap between the size of its GDP and that of the US. The combination
of enforced exchange rate increases and reduction in investment, therefore,
allowed the US to gain a decisive strategic competitive victory over Japan.
Slide
41
 (next part)